
Global travel demand is growing again. That much is clear.
What is changing, and what many dashboards still fail to surface, is where that growth is actually coming from.
Across multiple data sources, the signal is consistent: international travel demand is becoming less concentrated in a small set of iconic cities and increasingly distributed across secondary cities, regional hubs, and alternative “dupe” destinations that barely registered a decade ago.
This does not appear to be a short-term post-pandemic anomaly. It looks more like a durable reallocation of demand.
For travel tech leaders, airlines, OTAs, marketplaces, and growth teams, this shift carries real strategic consequences.
The Macro Context: Demand Is Strong, but Uneven
According to UN Tourism, international tourist arrivals reached 1.523 billion in 2025, surpassing 2019 levels by roughly 4%. Europe alone welcomed 793 million arrivals, up 6% versus pre-pandemic levels, confirming that the region remains structurally resilient even as some destinations approach saturation.
Looking ahead, Skift Research projects approximately 5% global travel industry growth in 2026, describing the market as one defined by resilience rather than acceleration.
Demand is not the problem.
Distribution is.
What Google Trends Shows: Less Concentration, More Breadth
To understand how demand distribution has evolved over time, I analyzed a directional sample of Google Trends data for U.S. users searching queries like “flights to [destination]” from 2004 through 2025.
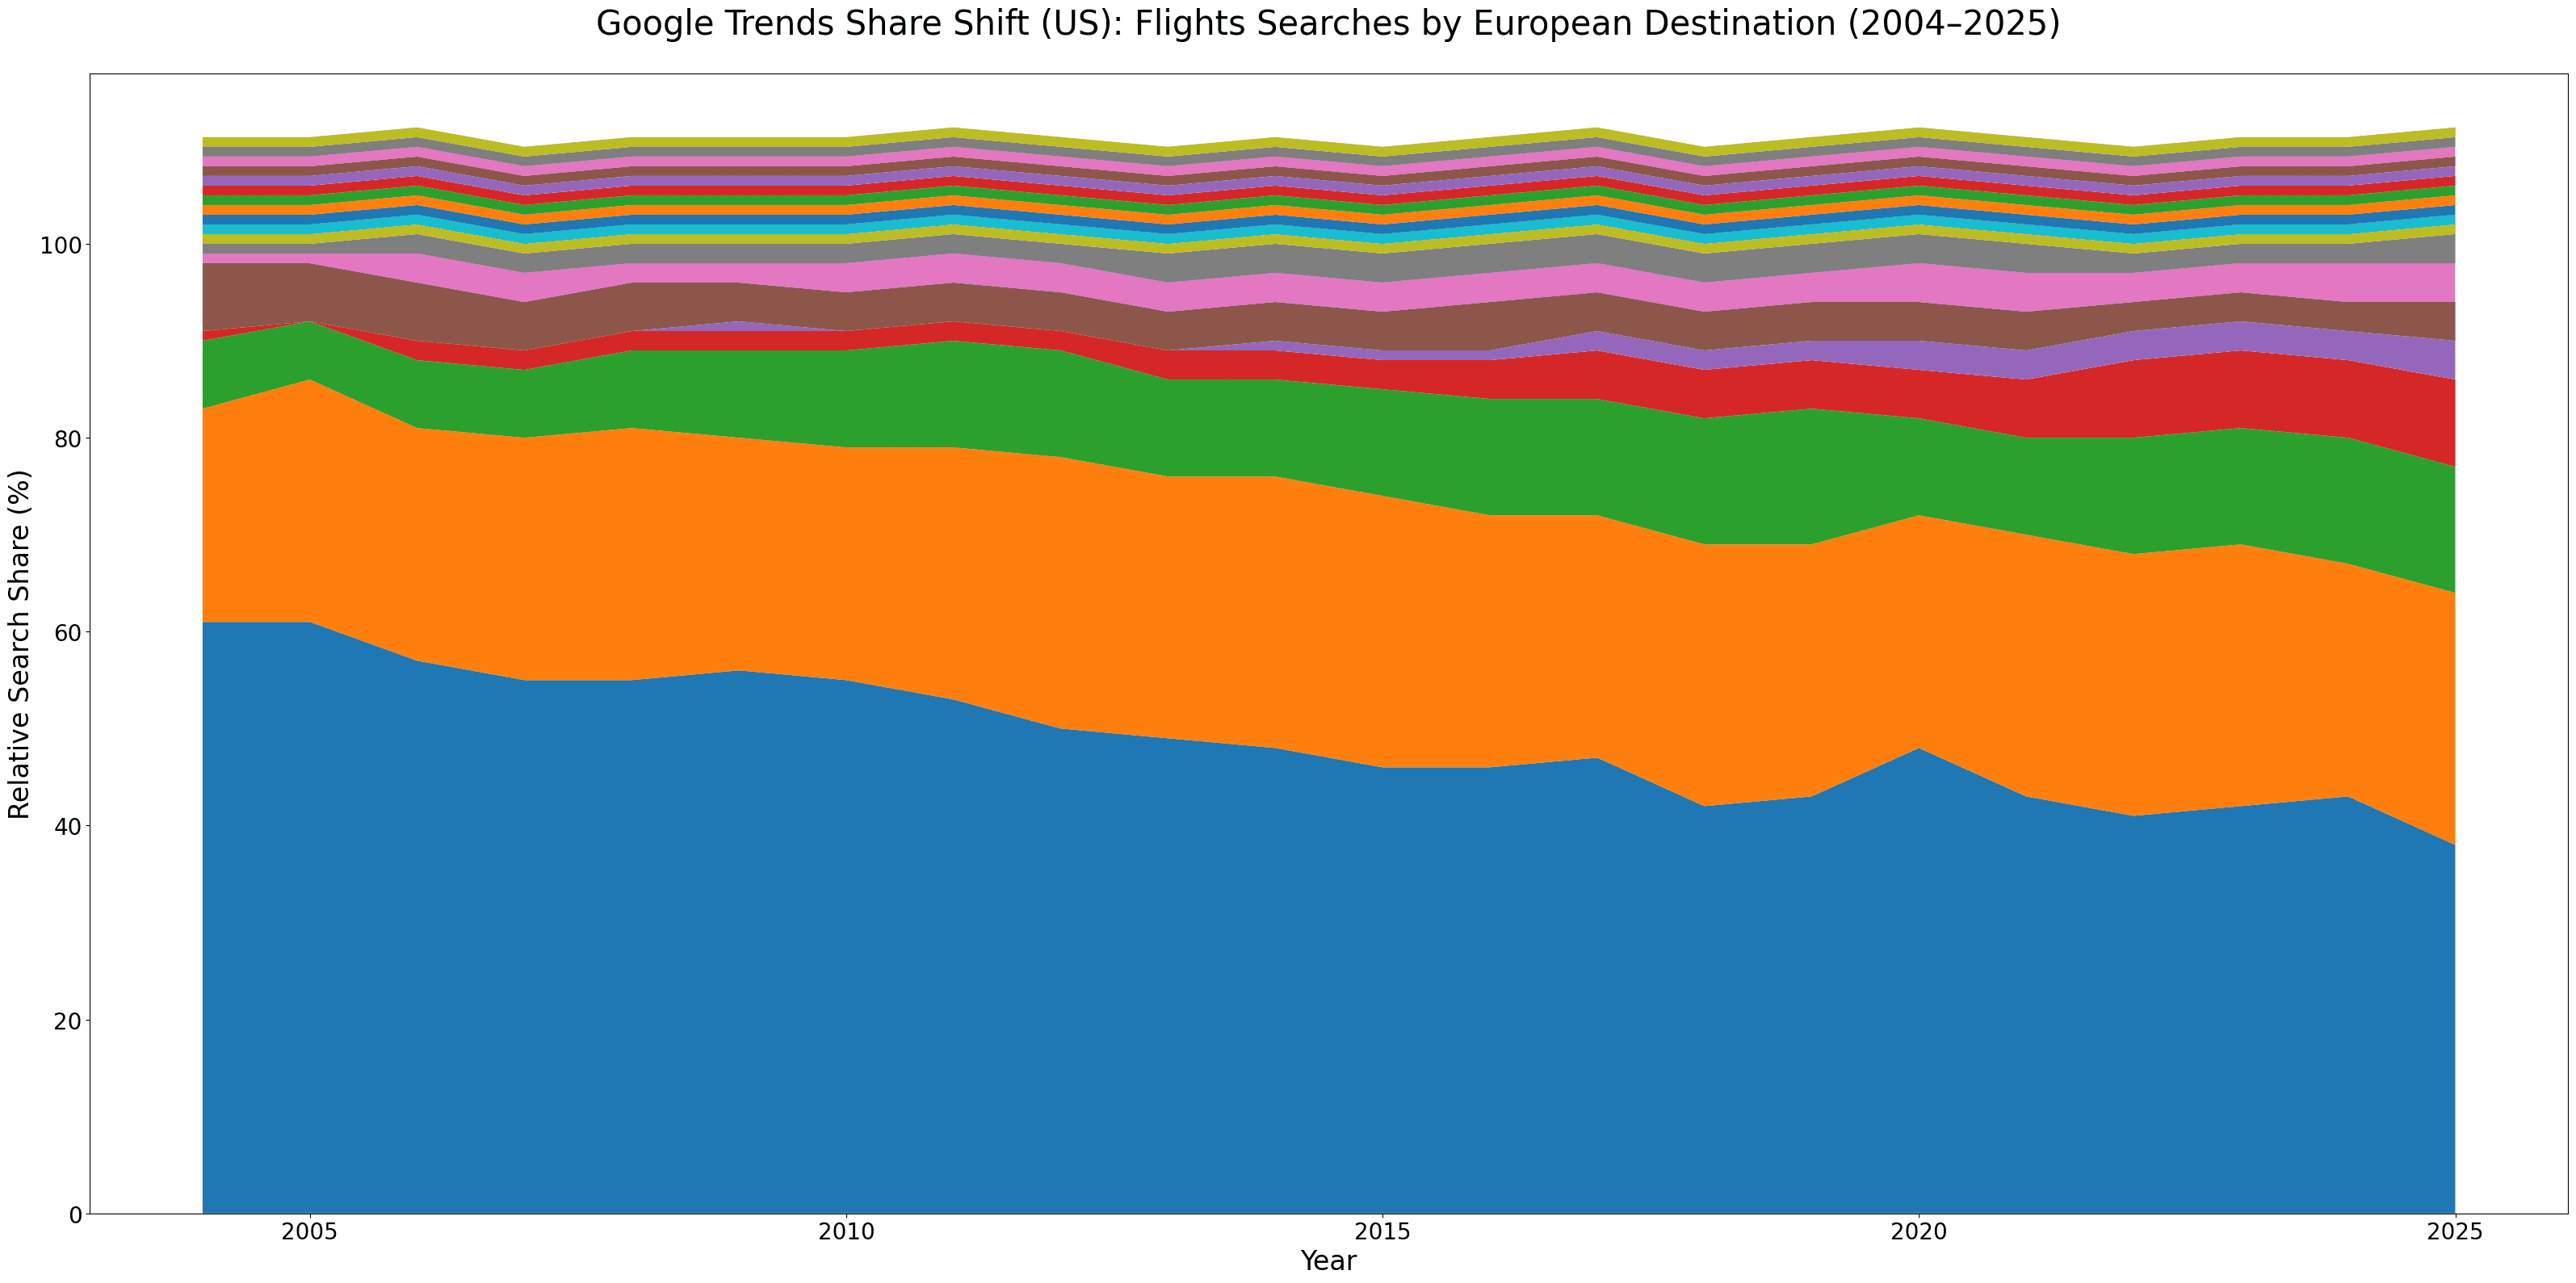
This analysis should be interpreted with clear limitations. It reflects relative search interest, not bookings or revenue. It is U.S.-only and covers a subset of European destinations, not the entire market.
Even with those caveats, the long-term patterns are consistent and revealing.
Across multiple destination cohorts, always using London and Paris as baselines, three structural signals emerge. First, absolute interest in London and Paris remains high, but their share of total interest has declined over time. Second, many secondary cities show faster relative growth, even when starting from much smaller bases. Third, aggregate growth increasingly comes from many destinations contributing incrementally, rather than a few cities dominating the curve.
The critical insight is not that London or Paris are shrinking in absolute terms.
It is that most of Europe’s incremental demand growth over the last decade appears to be coming from elsewhere.
London’s Relative Share Has Eroded More Than Any Other Major City
London remains one of the most searched-for cities globally. However, when viewed through the lens of relative growth and share of interest, it appears to have lost more ground than other major European destinations.
Several forces likely contribute to this shift. These include extreme saturation and overtourism fatigue, substitution toward nearby or culturally similar alternatives, persistent price inflation across flights and accommodations, and incremental policy friction.
The UK’s introduction of ETA visa requirements adds a small but meaningful layer of friction to what was historically one of Europe’s easiest entry points. On its own, this is unlikely to suppress demand materially. But in a market where travelers face abundant substitutes, friction compounds at the margin.
Travel demand is not disappearing from London.
It is being reallocated.
Discovery Changed First. Airlift Followed.
This redistribution of demand did not begin with airlines. It began with discovery.
Short-form video, social platforms, streaming content, and food- and culture-driven media have reshaped how destinations enter the consideration set. Travelers increasingly encounter places emotionally and passively before conducting explicit searches.
According to Expedia Group, 81% of Gen Z and Millennials report that film, television, or social content influences their destination choice.
Discovery alone, however, does not create sustained demand.
Flights do.
Low-cost carriers fundamentally rewired Europe’s travel graph. EUROCONTROL data shows that low-cost carriers now account for over 32% of all European flights, up from near zero in the late 1990s. Airlines such as Ryanair, easyJet, Vueling, and Wizz unlocked hundreds of secondary airports, turning once-niche cities into viable mainstream options.
Curiosity created interest.
Airlift converted it into demand.

Google Ads Data Reveals a Monetization Gap
Google Trends shows where demand is growing.
Google Ads Keyword Planner shows how unevenly that demand is monetized.
Using hotel search queries (“hotels in [destination]”) across English-speaking markets (US, UK, Canada, Ireland), I compared iconic European destinations with their closest “dupe” alternatives.
Several defensible patterns emerge.
🌍 Iconic City | 💰 CPC | 🔥 Comp | ➜ | 🌱 Dupe City | 💰 CPC | 🔥 Comp | 🧠 What’s Happening |
|---|---|---|---|---|---|---|---|
Paris | $0.76 | 89 | ➜ | Bordeaux | $0.61 | 78 | Cheaper clicks + less crowding |
Venice | $0.88 | 85 | ➜ | Annecy | $0.51 | 57 | Clear arbitrage zone |
Amalfi Coast | $0.61 | 7 | ➜ | Albanian Riviera | $0.26 | 1 | Massive underpriced demand |
Barcelona | $0.83 | 94 | ➜ | Valencia | $0.83 | 53 | Same CPC, far less competition |
Rome | $0.83 | 85 | ➜ | Bologna | $0.66 | 86 | Cost relief, same fight |
London | $0.79 | 97 | ➜ | Edinburgh | $0.68 | 99 | Slight CPC win, no escape |
Florence | $1.08 | 71 | ➜ | Lecce | $0.56 | 72 | CPC cut in half |
Ibiza | $0.53 | 78 | ➜ | Formentera | $0.39 | 66 | Lower CPC, lighter auction |
Vienna | $0.86 | 74 | ➜ | Budapest | $0.72 | 81 | CPC down, competition up |
While not exhaustive, two patterns consistently emerged. Low-range CPCs for dupe destinations are materially lower, typically 15–30% cheaper on average, with some extreme cases showing significantly larger gaps. At the same time, competition indices often fall by 20–40 points, though not universally. Some dupe destinations inherit much of the same auction pressure as their iconic counterparts, while others remain dramatically under-contested. Importantly, commercial intent remained strong across both groups, as queries like “hotels in [destination]” signal booking proximity regardless of city size.
The CPC-versus-competition quadrant chart makes this dynamic explicit. Iconic destinations cluster in high-CPC, high-competition territory. Dupe destinations more frequently shift left and downward into more efficient zones. The opportunity is not universal, but where it exists, it is structural rather than tactical.
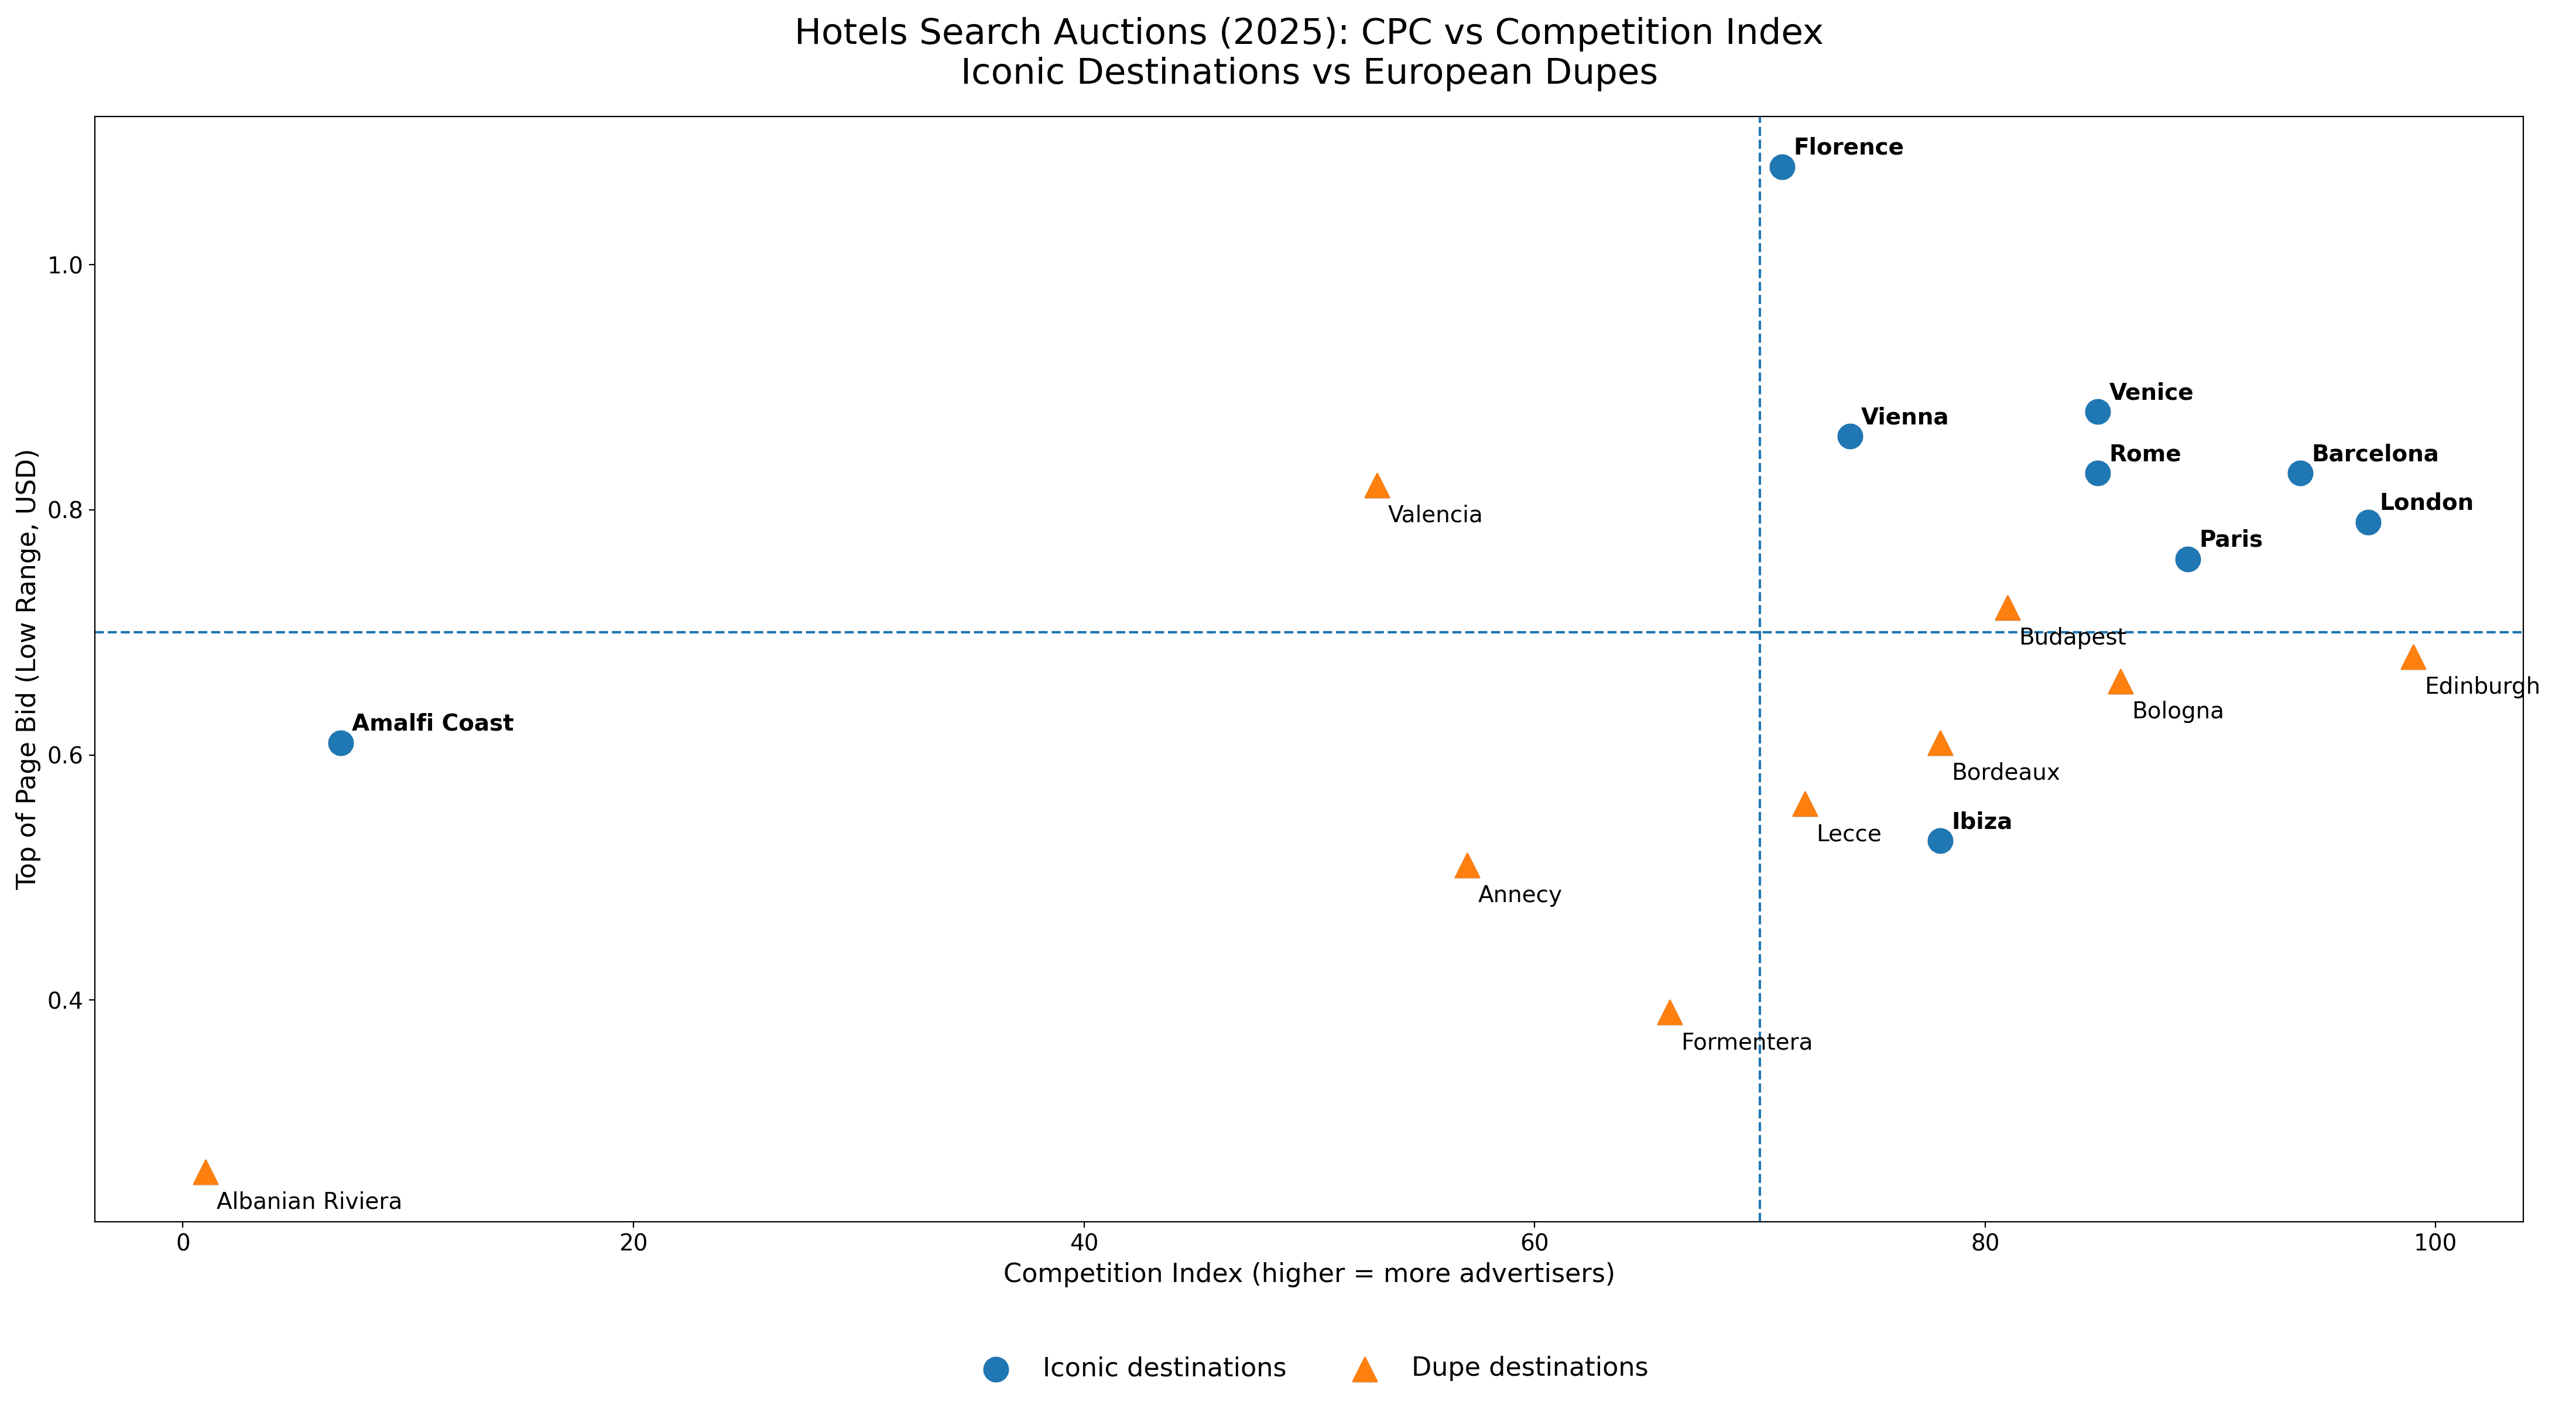
In practical terms, it costs less to enter the auction, fewer advertisers compete for attention, ads align more closely with user intent, and CTR and conversion rates often improve.
This gap exists not because dupe destinations lack value, but because most advertisers are structurally unprepared to cover them at scale.
The Rise of the “Detour” Destination
This shift is not limited to search data.
Expedia Group’s Unpack ’25 research confirms that we have entered the era of the “Detour Destination.” In a global survey of more than 25,000 travelers, 63% reported they are likely to visit a secondary or detour destination on their next trip.
Travelers are not abandoning iconic regions. They are zooming in on neighboring cities and regions to avoid overtourism and extract better value in an inflation-constrained environment.
Expedia highlights examples such as:
Reims as a detour from Paris
Brescia as a detour from Milan
Girona as a detour from Barcelona
Fukuoka as a detour from Tokyo
Santa Barbara as a detour from Los Angeles
Demand is not collapsing.
It is redistributing.
Fragmentation Creates Opportunity, but Also Complexity
Fragmented demand changes the economics of performance marketing.
In concentrated markets, optimization wins. In fragmented markets, coverage wins first.
Travel brands now face two parallel requirements. The first is inventory coverage: having supply where demand is emerging. The second is campaign coverage: structuring campaigns to capture hundreds of smaller demand pockets without collapsing under operational complexity.
Many PPC and growth setups struggle here. They were built for clean keyword lists, obvious destinations, narrow geo targeting, and defensive bidding on head terms.
That model works when demand is concentrated.
It breaks down when growth comes from the long tail.
Why Long-Tail Destinations Often Outperform
Individually, long-tail destination queries appear insignificant. Collectively, they are substantial.
They often outperform because intent is clearer, ads align more precisely with queries, competition density is lower, and learning curves stabilize faster.
This explains why two brands with similar inventory can see dramatically different performance outcomes. One competes where demand is obvious. The other captures demand where it is emerging.
What This Means for Travel Tech Leaders
For travel tech leaders, this shift requires a change in mindset.
Growth is no longer unlocked by adding more budget to the same cities, defending brand terms harder, or scaling what worked five years ago.
Increasingly, growth comes from geographic intelligence, long-tail demand mapping, flexible campaign architecture, tight alignment between inventory, geo, and creative, and early entry into emerging destinations.
The competitive advantage is no longer bidding power.
It is structural preparedness.
The Bottom Line
Travel demand is growing. But the growth is no longer concentrated where it used to be.
London and Paris still matter, but they are no longer the primary engines of incremental growth. Expansion is increasingly distributed across secondary cities enabled by social discovery, low-cost airlift, and changing traveler preferences.
Brands that focus only on head destinations will compete harder for smaller marginal gains. Brands that adapt to fragmentation will capture demand earlier, cheaper, and more efficiently.
This is not a tactical shift.
It is a structural one.
And it is already reshaping the travel market.
Sources
Google Trends – “Flights to [Destination]” (U.S., 2004–2025)
Google Ads Keyword Planner – Hotel demand, CPC & competition benchmarks
UN Tourism – World Tourism Barometer & Factsheet (Jan 2026)
Skift Research – 2026 Outlook & Data Pulse
Expedia Group – Unpack ’25, Set-Jetting Research
EUROCONTROL – Low-Cost Carrier Data Snapshot


Featured contributor on the HubSpot

Sam Lauron Dec 14, 2023
When and How to Build International PPC Campaigns
“One-size-fits-all templates don’t work,” says Flavio Rodrigues, an SEM consultant who runs the consultancy, Digital Sardine. “There are differences in languages and dialects, currencies, user behaviors, and even payment methods,” he adds.