
Most travel brands approach international expansion in a predictable way. They pull search demand by country, sort the list from highest to lowest, prioritize the largest markets, localize campaigns, and launch. On the surface, this method appears rational. Larger countries generate more search volume, which implies greater opportunity. However, in practice, this approach frequently compresses margins, increases operational complexity, and stretches internal teams without delivering proportional returns.
The core issue is that travel expansion is not one-dimensional. Population size and search demand alone do not determine profitability. A more disciplined framework must consider multiple structural variables: population as a theoretical ceiling, overall category search demand, purchasing power, travel intensity, destination-specific demand, and operational complexity. Ignoring any one of these factors can distort sequencing decisions and lead to costly expansion mistakes.
Step 1: Understanding Overall Market Structure Through 2025 Search Demand
The table below reflects 2025 Google search volume for vacation rental–related queries by country. It includes population, GDP per capita, total annual search demand, and a Market Quality Score (MQS) scaled from 0 to 100.
The Market Quality Score balances three core elements: 60 percent weight on total demand size, 25 percent on GDP per capita as a proxy for purchasing power, and 15 percent on demand per capita to capture travel intensity. This weighting ensures that large markets remain dominant, while still adjusting for monetization stability and purchasing power differences.
🌍 Overall Vacation Rental Search Demand (2025)
Country | Population | GDP per Capita (USD) | 2025 Search Demand | MQS (0–100) |
|---|---|---|---|---|
United States | 341,000,000 | 85,000 | 40,000,000 | 100 |
United Kingdom | 67,800,000 | 52,000 | 20,000,000 | 91 |
France | 65,300,000 | 56,000 | 10,000,000 | 83 |
Germany | 83,200,000 | 58,000 | 10,000,000 | 81 |
Brazil | 217,000,000 | 11,000 | 10,000,000 | 58 |
Spain | 47,900,000 | 46,000 | 9,000,000 | 80 |
Italy | 58,900,000 | 47,000 | 9,000,000 | 78 |
India | 1,430,000,000 | 2,800 | 9,000,000 | 42 |
Netherlands | 17,600,000 | 65,000 | 5,000,000 | 85 |
Australia | 26,700,000 | 69,000 | 5,000,000 | 87 |
Canada | 39,800,000 | 64,000 | 5,000,000 | 84 |
South Africa | 62,200,000 | 7,800 | 4,000,000 | 54 |
Mexico | 130,000,000 | 12,200 | 3,000,000 | 55 |
Japan | 124,000,000 | 42,000 | 3,000,000 | 70 |
Thailand | 72,000,000 | 21,000 | 3,000,000 | 60 |
Ireland | 5,300,000 | 105,000 | 2,000,000 | 74 |
Switzerland | 8,900,000 | 95,000 | 2,000,000 | 77 |
Portugal | 10,300,000 | 42,000 | 2,000,000 | 73 |
Belgium | 11,800,000 | 65,000 | 2,000,000 | 76 |
Indonesia | 282,000,000 | 6,000 | 2,000,000 | 44 |
This dataset reflects structural category-level search interest in 2025. Several patterns emerge immediately. India and Brazil demonstrate substantial demand scale but score significantly lower on monetization stability. The Netherlands and Australia, despite smaller populations, generate disproportionately strong Market Quality Scores. Canada combines strong demand with high purchasing power, making it structurally attractive. Indonesia, while large in population, presents limited monetization leverage.
However, even this analysis is incomplete. Travel demand is not purely global; it is destination-specific.
Step 2: Evaluating Destination-Specific Search Demand
If your inventory is concentrated in U.S. destinations, evaluating global vacation rental search demand is too broad. The more relevant question becomes: which countries are actively searching for U.S. accommodations?
The table below reflects relative 2025 Google search volume for U.S. accommodation–related queries by origin country.
Top Origin Markets Driving U.S. Accommodation Search (2025)
Country | Relative Search Demand Index |
|---|---|
Canada | 100 |
United Kingdom | 60 |
Australia | 18 |
Mexico | 18 |
Germany | 18 |
Brazil | 17 |
France | 16 |
Japan | 14 |
India | 12 |
Italy | 10 |
Spain | 8 |
Argentina | 5 |
Netherlands | 4 |
Ireland | 3 |
Belgium | 3 |
Switzerland | 2 |
Singapore | 2 |
This data represents destination-aligned intent. The disconnect becomes clear when comparing global demand to U.S.-specific demand. Portugal, for example, generates two million global vacation rental searches in 2025 but shows negligible search demand for U.S. accommodations. If your supply is U.S.-heavy, Portugal is not a logical priority despite appearing attractive in global demand tables.
Population defines theoretical ceiling. Destination-specific search demand defines actionable direction.

Step 3: Combining Scale, Quality, and Alignment
A disciplined expansion model evaluates markets across four dimensions simultaneously: overall search demand, Market Quality Score, destination-specific search demand, and operational complexity. When these factors are combined, expansion sequencing becomes strategic rather than reactive.
This framework prevents overinvestment in markets that appear large but lack inventory alignment, and it elevates markets that demonstrate both demand and monetization strength.
The 2×2 Expansion Framework
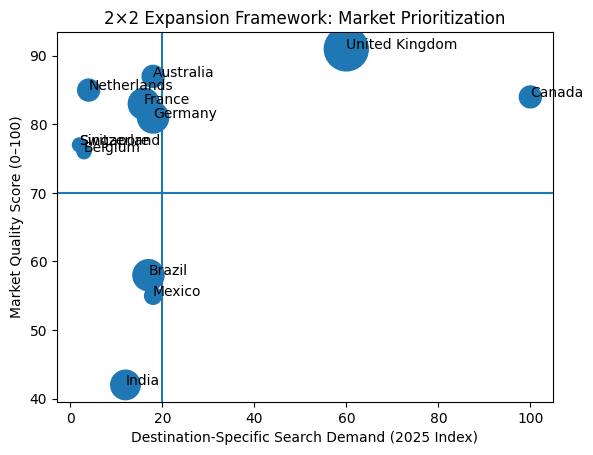
To simplify executive decision-making, markets can be plotted along two primary axes. The horizontal axis represents destination-specific search demand. The vertical axis represents Market Quality Score, capturing monetization stability. Bubble size represents overall global search demand.
In the upper-right quadrant, where destination demand and monetization stability are both high, we find Canada, the United Kingdom, Australia, Germany, and France. These markets demonstrate strong intent for U.S. accommodations and possess the purchasing power and operational stability required for scalable growth. This is where disciplined expansion compounds profit.
In the upper-left quadrant, where monetization stability is strong but U.S. demand is lower, markets such as Switzerland, the Netherlands, Belgium, and Singapore become selective growth opportunities. These are high-quality markets, but scaling should be targeted rather than aggressive.
In the lower-right quadrant, markets such as Brazil, Mexico, and India demonstrate meaningful U.S. search demand but lower monetization stability. These markets require structured expansion with tight controls around fraud, payment methods, cancellation management, and localization.
In the lower-left quadrant, markets with low destination demand and weaker monetization profiles should be deprioritized. Population alone does not justify entry.
Strategic Conclusion
Expansion should not begin with the question, “Which countries are largest?” Instead, it should begin with, “Where does search demand align with our inventory, and can we monetize it efficiently?”
Search demand reveals interest. Destination demand reveals direction. Inventory provides leverage. Purchasing power and travel intensity determine margin durability.
Population defines potential. Search demand defines intent. Inventory defines advantage. Monetization defines sustainability.
The travel brands that combine all four dimensions expand more intelligently, allocate capital more efficiently, and scale profitably over time.


Featured contributor on the HubSpot

Sam Lauron Dec 14, 2023
When and How to Build International PPC Campaigns
“One-size-fits-all templates don’t work,” says Flavio Rodrigues, an SEM consultant who runs the consultancy, Digital Sardine. “There are differences in languages and dialects, currencies, user behaviors, and even payment methods,” he adds.